A statistic is not evidence until you can say what it counts, over what period, and against what base. In the HIR contest’s 60-mark rubric, use of evidence and analysis of evidence are two separate five-point dimensions — ten marks that a dropped-in figure cannot earn. This guide gives the five questions every number must survive, four ways numbers quietly mislead, and where they belong inside 800–1,200 words.
Why a single number is scored twice
Most students treat a statistic as a full stop: find the figure, state the figure, move on. The rubric treats it as two separate jobs. Content is worth 30 of the 60 marks, split across six five-point dimensions — topic, introduction, structure and transitions, use of evidence, analysis of evidence, and overall coherence of argument (our breakdown of the 60-point rubric works through all eleven dimensions). Two of those six are about evidence, and they measure different things.
Use of evidence asks whether you selected a figure that actually bears on the claim you are making, and whether a reader can verify it. Analysis of evidence asks what you did with it once it was on the page — what it means, what it excludes, and what follows for your argument. A well-chosen statistic that is stated and then abandoned wins half of what it could. A weak statistic that is beautifully analysed wins the other half. Only a figure that is both well chosen and properly worked earns the full ten.
There is also a hard rule underneath this, not just a scoring preference. The contest page states that “All factual claims must be backed by a citation from a reliable source” and that “Citations should be made via hyperlinks” (hir.harvard.edu). So an unsourced number is not a stylistic weakness — it is a claim you were asked to support and did not. If you cannot find a link for a figure, the figure does not go in the draft. That single discipline removes most of the trouble described below, because the numbers that cannot be traced tend to be exactly the numbers that would not survive scrutiny.
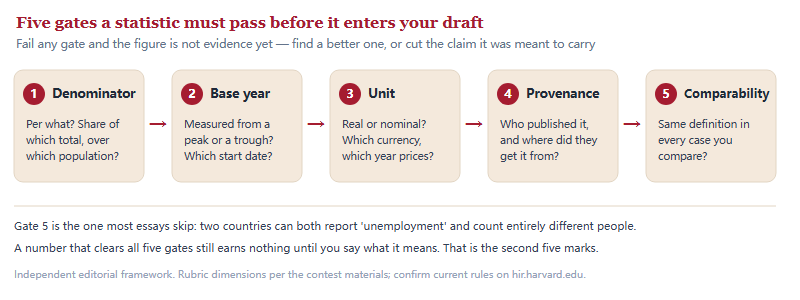
Five questions a statistic must survive
Run every figure through these before it reaches the draft. The whole audit takes about two minutes per number, and it is the difference between a paragraph that reads as researched and one that reads as googled.
| Question | What you are really checking | What it looks like when it fails |
|---|---|---|
| 1. What is the denominator? | Per capita, per unit of output, as a share of a total, or a raw count — and which total | “The largest exporter of X” with no sense of whether that is by value, by volume, or as a share of world trade |
| 2. What is the base year? | Where the measurement starts, and whether that start point is a normal year, a peak or a crisis trough | “Up 60 percent since 2020” — when 2020 was the abnormal year that makes any recovery look explosive |
| 3. What is the unit? | Nominal or inflation-adjusted, market exchange rates or purchasing power, which currency, which price year | Setting a 1995 figure beside a 2024 figure in current dollars, so much of the “growth” is just prices |
| 4. Who produced it? | The chain: your source, their source, and the body that actually collected or estimated the data | A news article cites a think tank, which cites a projection, which the essay then reports as a measurement |
| 5. Is it comparable? | Whether the same word means the same thing in every case you place side by side | Two national statistics offices counting “broadband access” or “refugee” by different definitions |
Question 4 deserves a note, because it is where international-affairs writing goes wrong most often. A great deal of what circulates as data in this field is actually a projection, a model output, or an estimate with a wide interval, and the wording gets flattened at every step of the chain: the institution says “estimated,” the report says “is,” and by the time it reaches an essay it has become a fact. Tracing a figure back one or two links usually takes three minutes and often changes how you can honestly phrase the sentence — which is the point.
The same figure, dropped and worked
Here is what those ten marks look like on the page. The figures below are illustrative placeholders, invented to show the shape of the writing — use real, hyperlinked numbers in your own draft.
Version A, dropped in. “Renewables rose from 18 percent to 31 percent of the country’s electricity generation over the decade, showing that the energy transition is well under way.” That sentence has a number and a conclusion and almost nothing in between. It scores modestly on use of evidence if it is sourced, and close to nothing on analysis, because the entire analytical content is the phrase “well under way” — which is an impression, not an inference.
Version B, worked. “Renewables rose from 18 to 31 percent of electricity generation over the decade [hyperlink to the agency dataset]. Two things follow from that, and one does not. It follows that the power sector is decarbonising faster than the headline debate assumes; it also follows that the remaining 69 percent is now concentrated in the plants that are hardest to retire. What does not follow is a claim about the energy system as a whole: generation excludes transport fuel and industrial heat, which is where the harder half of the problem sits.”
Version B is about 65 words longer and it moves both evidence lines, because it does three things the first version does not. It names what the figure counts (generation — not capacity, not total energy). It states what the figure excludes. And it draws a bounded inference rather than a mood.
That third move — saying explicitly what does not follow — is the highest-value sentence pattern available to you in this contest, and in our coaching experience it is rare in student drafts. It signals that you understand your own evidence well enough to police its limits, which is precisely what “analysis of evidence” is asking about. It also happens to be the sentence that protects you at the oral defense, because you have pre-empted the obvious challenge before a judge can make it. Students worry that admitting a limit weakens the essay. In a rubric that scores analysis separately from evidence, the opposite is true: the limit is the analysis.
Four ways a number quietly misleads
None of these require anyone to lie. They are ordinary reporting conventions that become misleading the moment they are lifted into an argument. Learn the four and you will catch them in your own drafts and, more usefully, in the sources you are reading.
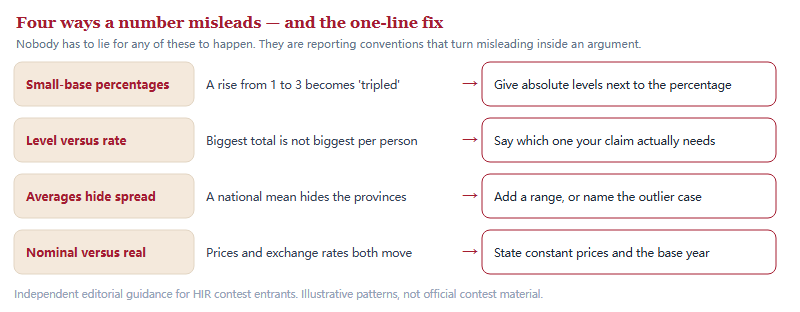
Small-base percentages. A percentage change tells you nothing about scale. Something that grows 300 percent may have gone from three facilities to twelve, which is a real fact but rarely the fact the essay implies. Give the levels and the percentage together and the reader can judge for themselves — which, incidentally, is what a fair-minded analyst does and an advocate does not.
Level versus rate. The largest total emitter, spender or producer is frequently not the largest per person, and the two support different arguments. Neither measure is dishonest; silently choosing whichever one flatters your case is. Decide which measure your claim actually requires, use it, and spend half a sentence saying why that is the right denominator here. Judges notice that half-sentence.
Averages hide spread. National figures average over enormous internal variation, and in a country the size of China, India or Brazil a national mean can describe almost nobody. If your argument turns on a distribution — who gains, who loses, where the effect concentrates — an average is the wrong instrument. Add a range, a top-and-bottom pair, or one named case.
Nominal versus real. Any comparison across years needs adjusting for prices, and any comparison across countries needs a stated conversion basis. Name the price year, say whether the figures are constant or current, and if you convert currencies, say how. This costs you about eight words and buys precision that reads as expertise.
Where numbers sit in 800–1,200 words — and what happens at the oral defense
The contest sets a tight envelope. Its page states that articles “should be at least 800 words but not exceed 1,200 words (not counting diagrams, tables of data, or authorship declaration)” (hir.harvard.edu). Two things follow for how you budget numbers.
First, the exclusion for diagrams and data tables means a well-built table can carry comparative figures without consuming prose you need for argument — but only if the prose then does something with it. A table nobody analyses is decoration, and decoration does not score. Second, and more important: in roughly a thousand words you have room for perhaps two to four load-bearing figures, each fully worked, not a dozen scattered as ornament. The instinct to prove diligence by volume is one of the most common ways students burn their word count. One number, properly interrogated, outscores five dropped in passing, because five dropped figures can only ever earn the “use” half of the marks.
Then there is the part that should change how you treat your data from the research stage onward. HIR’s materials describe judges at Defense Day “conducting even more careful review and assessment during the interview stage to ensure authenticity of work” (hir.harvard.edu), in a session the contest describes as a 15-minute presentation and oral defense. Numbers are the natural probe in that room, because they are specific and checkable. The three questions to expect are the ones you have already met above: where did this figure come from, what does it exclude, and what would change your reading of it? A student who worked the number answers each in a sentence. A student who lifted it from a summary article can usually manage the first and not the second. Our Defense Day preparation guide covers the wider session; the narrow rule for data is simply this: never put a number in the essay you would not want to be asked about out loud.
If you are reading this at the turn of the cycle — check whether the summer round is still open on hir.harvard.edu — this is among the most useful things to practise now, because it is a research habit rather than a writing trick, and habits need weeks rather than days. Take three articles on your theme, pull every statistic out of them, and run the five gates on each. You will often find that several of the figures cannot be traced past the second link, and that discovery does more for your next draft than another round of editing your introduction. At the time of writing, the contest page lists a Fall–Winter round with an article deadline of January 2, 2027 and Defense Day on February 5, 2027, with registration described as rolling and capacity limited — but confirm current dates and open your entry on hir.harvard.edu rather than relying on any second-hand calendar, including ours. If the contest is new to you, start with our overview of what the HIR Academic Writing Contest is.
Frequently asked questions
Do I really need a citation for every statistic?
Yes. hir.harvard.edu states that all factual claims must be backed by a citation from a reliable source, made via hyperlinks.
Do data tables count toward the 800–1,200 words?
The contest page says the limit excludes diagrams, tables of data and the authorship declaration. Confirm on hir.harvard.edu.
How many statistics should a 1,000-word essay carry?
There is no official number. Two to four load-bearing figures, each fully worked, usually beats a dozen dropped in passing.
Can I cite a statistic I found in a news article?
Yes, if the outlet is reliable and you hyperlink it. Where you can, trace the figure back to the body that produced it.
This is an independent guide operated by Hanlin Education for China-based international-school students. We are not affiliated with, endorsed by, or sponsored by the Harvard International Review or Harvard University. The HIR Academic Writing Contest is run by the Harvard International Review, a student-run journal founded in 1979. Contest rules, dates, word limits and evaluation criteria change between cycles — confirm current details on hir.harvard.edu before you enter. Statistics used as examples above are illustrative placeholders, not reported facts. Factual corrections are made within 7 working days.